Just a few days ago, a reliable but anonymous source shared with me telemetry data from the day of the blackout, covering thousands of solar inverters deployed across Spain. Yesterday evening, the Spanish government released its official report on the blackout.
In this post I present a detailed analysis of the telemetry data to understand how inverter-based resources may be linked to the voltage oscillations. This analysis offers a cyber-physical perspective that has not yet been publicly explored, and remains under investigation, according to the official report (p. 84-87)
I would like to mention that yesterday morning, many hours before the official report was published, I informed INCIBE of my intention to publish this research. I believe this heads-up was the right thing to do.
Watch out, a long read ahead.
Introduction
The following summary may be helpful for those looking to catch up on this complex scenario.
Week 1: Introduction to the Spanish transmission network and the cyber-physical aspects of photovoltaic (solar) power plants.
Week 2: Generation loss events, key elements of the Spanish power grid, and a cyber-physical perspective on nuclear power plants.
Special Focus – The Granada Incident: The event that triggered the cascade of generation losses.
Week 3: Analysis of publicly available official statements. Additional concepts related to the Spanish power grid, including programming units, physical units, and regulation zones.
Week 4: Partial reconstruction of PV generation behavior in response to voltage oscillations. Introduction to the ‘ENDESA video’.
Week 5: No analysis due to the lack of relevant publicly available information.
Week 6: Analysis of the HVDC interconnection between France and Spain, alongside newly released official details.
Initial Analysis of Telemetry Data
I received the telemetry dataset as-is. The first thing I did, after verifying the validity of the data (a procedure I won’t detail publicly), was analyze it to understand its limitations and determine the best way to extract meaningful information.
It’s important to note that these inverters span from the residential market (rooftop) to the commercial and small-scale industrial sectors, positioning them downstream of the transmission and distribution networks.
The dataset contained the following fields, collected over periods of 1-minute.
- Active Power (P)
- Reactive Power (Q)
- Apparent Power (A)
- DC Voltage
- Cosine phi
- AC Voltage
- AC Frequency
- Location
- Inverter ID
- Timestamp
This is my reasoning on whether to use them or not, and how.
AC Voltage and AC Frequency: The lack of real-time measurements is an important caveat when approaching the analysis logic based on any parameter from the point of connection with the grid. I don’t know how these telemetry values are calculated, whether they are averaged over each interval or represent instantaneous values. Therefore, I considered them meta rather than actual features.
Cosine phi: The power factor in the telemetry is essentially binary, either 1 or 0. Therefore, it can be useful for developing logic to detect potential malfunctions.
DC Voltage: Based on the values and the variable name, I concluded that this represents the DC voltage measured at the inverter’s DC bus, after the DC-DC boost stage. Therefore, it is also useful for assessing the internal status of the inverter
P,Q,A: A similar situation to AC voltage and frequency applies here; however, in this case, the values are not inputs from the grid but are reported by the inverter itself. According to Spanish regulations, these inverters are not required to support any dynamic grid code functionalities, such as voltage control. As a result, they are primarily useful for identifying installation capacity and detecting potential malfunctions.
Location: This field indicates the autonomous region where the inverter was deployed. I focused only on the 15 regions (out of 17) that belong to the SEPE (Sistema Eléctrico Peninsular Español, Spanish Peninsular Power System).
Inverter ID: This ID serves as a unique identifier for each inverter.
Timestamp: The time when the telemetry was collected, formatted as HH:MM:SS
I divided the original dataset into smaller subsets based on the 15 potential locations of the inverters. This approach seemed logical, considering the alleged zoned characteristics of the blackout, especially between the north and south regions.
Looking for Malicious Patterns.
10 years ago, Willem Westerhof presented the “Horus Scenario”, a series of real-world vulnerabilities and techniques to attack distributed energy resources (DERs).
Basically, he explained that if attackers gain remote access to a sufficiently large number of photovoltaic inverters, such as residential ones, they could manipulate inverter’s power output in a synchronized way, either dropping or injecting power into the grid, causing large-scale frequency or voltage disturbances.
In the past ten years, numerous researchers, both from academic and non-academic fields, have published various techniques for attacking the power grid, centered around the assumed ability to control large numbers of DERs. In essence, all these techniques rely on sudden or rapid changes in the operating modes of inverters to induce forced oscillations or create imbalances in the system.
Initially, to rule out the possibility of a similar scenario occurring during the Spanish blackout, I attempted to detect such patterns in the dataset. My approach focused on identifying abrupt (although somewhat smoothed due to the telemetry interval) drops from normal values to zero or near-zero in Cosine Phi, active power (P) and reactive power (Q), as well as transitions in the opposite direction. Let’s elaborate on it.
To illustrate this logic, here is one of those patterns. It’s a three-phase inverter, but only the first phase is shown.

- At 11:10, the inverter is operating normally, generating near its maximum power point according to the I-V curve (an approximate representation is used here for illustrative purposes).
- At 11:11, the inverter suddenly stopped drawing current, causing both the power factor and active power (P) to drop to zero. As a result, the DC voltage rose close to its open-circuit voltage (Voc).
- At 11:15, the inverter is once again operating at optimal performance. This behavior suggests that, at some point between 11:10 and 11:15, considering that ramp-up times in power electronics are typically very fast and not limited by regulation in Spain, the inverter likely entered Momentary Cessation mode, awaiting suitable conditions to resume grid injection. The specific thresholds and recovery behavior vary depending on the inverter model and configuration. This is important, as we will see later.
The initial results left me somewhat baffled. In the south, where the blackout started, nearly 30% of the inverters exhibited these types of patterns in the hours leading up to the blackout.

It’s clear that something unusual was happening in the south. For reference, Catalonia (8.24% , Northeast) and Andalusia (28.25%, South) have a comparable number of deployed inverters.
So, was it a cyber-attack after all? No, it couldn’t be that easy. However, there was something intriguing about these results. Next, I defined one-minute intervals between 10:00 AM and 12:33 PM and incremented the count for each interval whenever one of these patterns was detected.
This was the result.

As shown, Andalusia is by far the largest contributor, followed by the other southern regions. A surprisingly high number of inverters exhibited these potentially malicious patterns almost simultaneously, suggesting a degree of synchronization.
And then I realized I’d seen these peak patterns before...
The ‘ENDESA Video’
During a recorded conference organized by the Real Academia de Ingeniería de Sevilla, Jose Casas, Director General of Institutional Relations and Regulation at ENDESA, provided some internal data regarding the blackout. When the video (hosted on youtube) started gaining traction, it was made private. It briefly became public again for several hours, but the portion featuring the ENDESA representative’s presentation had been removed. Finally, the video was set to private once more, and remains so to this day. Why it was taken down, or at whose request, remains unknown to me.
One of the slides presented by ENDESA showed the voltage oscillations detected at their observable facilities (400kV): two nuclear power plants (2 + 1 units) and two combined-cycle plants, all of them in the north of Spain. Around 9 am, oscillations began. From that point onward, they do not appear to have been fully damped, and near the time of the blackout, they seem to have become uncontrolled.
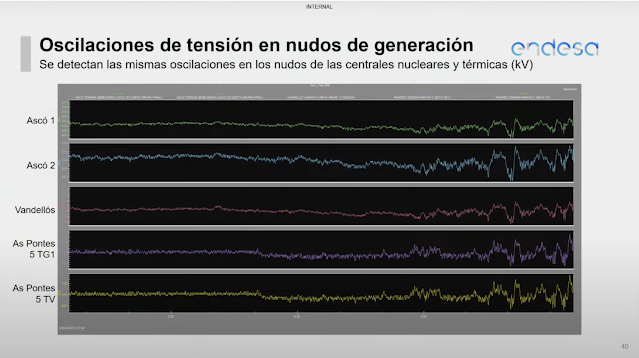
Now, let’s take a closer look at these oscillations from 10:00 onward, with our graph (also starting at 10:00) superposed: they show a clear positive correlation.

So, does this mean we’re seeing the patterns of a coordinated, large-scale cyber-attack against DERs, similar to those previously described? No, it's much more likely that what we're seeing is simply the kind of outcome you would expect from a sophisticated cyber-attack, only without the actual attack. Let's break it down.
Not an Attack, Just Cyber.
I believe the abnormal operating patterns detected in inverters serving residential and small-scale industrial consumers, particularly in the southern regions, are relevant for the following reasons:
In 2024, the installed power of self-consumption installations in Spain reached more than 8 GW, roughly the equivalent of 8 nuclear power plants.
Thousands of inverters may represent a small portion of the total, but it's a statistically significant sample. I’m sharing these findings because I’m confident that, when extended to the full deployment across Spain, the percentages and other figures I've presented would remain consistent.
The widespread penetration of DERs, particularly those injecting excess power back into the grid, has effectively transformed distribution networks into bidirectional systems. As a result, large-scale, simultaneous abnormal behaviors may have the potential to induce, either directly or indirectly, disturbances upstream into the transmission and distribution systems.
As early as 2018, REE had already anticipated the potential implications of widespread DER penetration and issued the following recommendations:
“It is important to highlight the need to initiate a series of contacts with manufacturers of domestic equipment using power electronics (PE) and industrial load owners in order to begin gaining a better understanding of the dynamic behavior of loads connected via PE, with the goal of achieving an appropriate characterization of demand in future scenarios.”
1.- Abnormal patterns are the cause of the observed voltage oscillations.
2.- Abnormal patterns are both a consequence of, and a contributing factor to, the voltage oscillations.

So, in this scenario, the voltage oscillations, or some other associated underlying disturbance still unknown, managed to propagate through the transmission network into the distribution network (or, to some extent, the other way around), eventually reaching residential and small-scale industrial inverters. The following diagram illustrates this situation.

"Given the timing of this drop in solar generation, during the upward ramp in production and without any weather phenomena to explain it, the most plausible explanation is market-related (prices)"
What happened exactly when the inverters from the dataset were hit by this disturbance?
In Spain, all inverters need to be certified according to the technical requirements defined by the “Norma Tecnica De Supervision”, which is aligned to the Category III defined in IEEE Std 1547. The inverters need to be able to ride through voltage transients according to a defined performance, to avoid generating unnecessary instability in the grid (unexpected disconnections, as the minister Sara Aagersen noted: 'desconexiones indebidas').

Based on the previously discussed DC voltage logic, the vast majority of inverters appear to have entered Momentary Cessation repeatedly during the successive waves of voltage oscillations, resuming normal operation within the next few telemetry intervals. However, a subset of inverters seems to have tripped and did not return to operation.
This varying response may depend on the design of the inverter control loops, firmware features, and configuration settings for grid protection.
How could this have been a contributing factor?
Besides the sudden imbalance in load and demand, and its impact on reactive power absorption (which in turn increases voltage), these repeated cycles of Momentary Cessation and recovery attempts may have contributed to amplifying the existing voltage oscillations or introduced additional disturbances due to Power Electronics-based artifacts, thereby further destabilizing the upstream power grid. These phenomena are well-documented and widely analyzed in multiple publications.
In this context, it’s worth referencing NERC’s Odessa Disturbance report.
The Odessa disturbance was a major incident that occurred on June 4, 2022, in West Texas. Within seconds, about 2.5 GW of photovoltaic (PV) generation unexpectedly dropped following a line-to-ground fault on a Generator Step-up Transformer at a Combined-cycle power plant near Odessa.
The NERC report states: ‘A significant number of solar PV resources responded to the BPS (Bulk Power System) fault event in an abnormal manner’. The report then provides a comprehensive description of the causes behind this behavior. However, it should be noted that this report focuses on the response of inverters used in large-scale PV generation plants, specifically those with a capacity of at least 10 MW.

I couldn’t find any publicly available reports assessing the behavior of residential inverters during large-scale grid incidents. The official Spanish government report addresses this topic but has been heavily redacted, at the request of the referenced companies. Additionally, their analysis appears to be limited, as not all contacted manufacturers ultimately provided the requested data.
"[...] the Committee has requested information from both distribution network operators and inverter suppliers, whose data should provide greater visibility into what happened downstream in the system."
Conclusions
I believe the official report addresses most of the expectations, but there remain specific unknowns regarding the role of power electronics (Inverter-Based Resources) in the sequence of events. The report also outlines what appears to be a tremendous effort to assess whether a cyberattack could have caused the blackout. Although no evidence supports this scenario, the working teams identified vulnerabilities and significant room for improvement, which is positive overall.
Although the analysis of the dataset I was given access to clearly points to a series of patterns that have been part of theoretical cybersecurity research, these same patterns have also been documented in regular grid incidents. The day after the blackout, I published an analysis explaining why I didn’t believe a cyber-attack was behind the incident. At this point, I think everyone agrees that a cyberattack can be 99.99% ruled out.
For seven weeks I’ve been publishing weekly analyses, featuring non-public data and original research. My intention was not to speculate, but to contribute verifiable data and context, so that we could be better prepared when the official explanations were released. So, after reading the report from the Spanish government, I believe the purpose has been fulfilled: those who have been following these weekly analyses will already be familiar with many of the concepts and issues raised, making the 182-page report easier to digest.
For me, it’s also been an exercise in self-education: a way to stay informed, especially since media coverage has largely focused on the political aspects rather than the technical ones. If you ask me, this remains a technical issue, one with implications that extend far beyond Spain.
Considering the role of photovoltaic generation in Spain and worldwide in the years ahead, it is crucial to understand the risks involved, learn from these incidents and be prepared for cyber-related scenarios. However, it’s important to emphasize that these are essentially (cyber-informed) engineering challenges to be solved, there is nothing inherently flawed or unreliable about photovoltaic technology. The same applies for nuclear energy.
If we want a sustainable future, or simply any future, we cannot afford to reject any type of carbon-free, scientifically sound energy source.